Win the Data Fight by Going Beyond the Data
WRITTEN by: Upward Brand Interactions |
categories:
News
The 2017 Interact Digital Marketing Conference kicked off its first day with in-depth, discussion-driven workshops that explore primary components of marketing. There was the Lead Generation workshop, which armed attendees to the teeth with actionable content that can convert any prospect. The Customer Experience workshop showed us how a gang of consumer advocates truly gives you an advantage. Finally, the Analytics + ROI workshop proved you should never bring an opinion to a data fight.
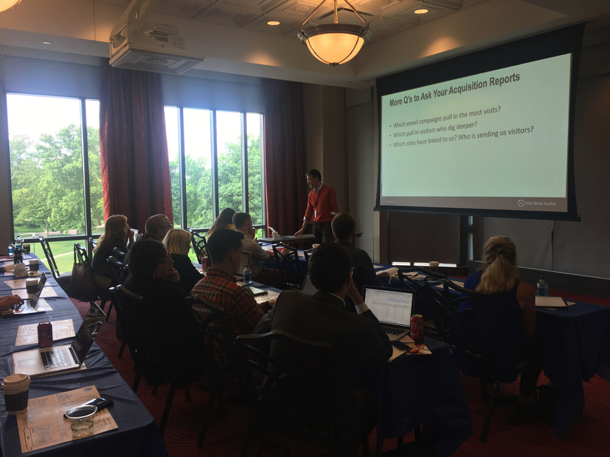
Let’s be honest. Analytics is a scary word – big numbers, lots of math, and endless buzzwords makes it an intimidating topic. Andy Crestodina of Orbit Media proved that analytics is not a scary thing, it’s just a little misunderstood – kind of like teenage angst. The difference? Analytics isn’t just a phase. To master data and win the analytics fight, you must go beyond the numbers.
Define your goals
As a marketer, if you don’t define your goals there is no possible way for you to track if something is working or not. If you can’t track if something is working, why would you analyze any of your data? As Andy puts it, “if you don’t set up goals, you’re not marketing.”
A goal may be to turn a website visitor into an email subscriber or a product lead. These are all conversion goals. Other types of conversions include:
? Closing a deal with e-commerce customers
? When users register for an upcoming event
? Users commit to donate to your company or organization
Use the right tools
The list of marketing and analytics tools on the internet is ever growing. Throughout the day, we learned about a couple of highly recommended programs to help you with your everyday digital marketer needs.
HotJar – See how users navigate through your website with easy to understand heat maps. See visually which parts of your website are most popular.
Ghostery – Use this web browser extension to see what web tracking programs any website is using. Great for security, and for gaining an edge on your competitors.
Snagit – Display your data visually with this user-friendly app. Take a screenshot of your data and then immediately add arrows, highlights, and text boxes to feature the most important parts. Make everything easier to understand for the rest of your team or a client.
Data Puke VS Analysis
Rejoice! You don’t need to be good at math to be an effective data analyst. What do you have to be good at, though? Strategic thinking. The biggest theme of the day was that no matter how much data you collect, if you don’t analyze it, the numbers are completely useless.
Data puking is when you simply spit your numbers back out. Trust us, this just makes your client feel sick.
Providing analysis is drawing insights and creating suggestions based on your data. Your LinkedIn profile is converting 5 percent more leads than Facebook to the newsletter subscriptions? Then let’s focus more attention on what we publish through LinkedIn, and continue to drive the upward trend.
Follow this process to draw effective insights from your data.
- You have an awesome idea
- Ask a question that supports the idea
- Find a report in your analytics program that supports (or rejects) the answer. If your idea is rejected, ask another question!
- Take action on the idea
- Test the action
What valuable, actionable insights can you draw from the data you’ve collected?

